Our Level 7 WorkKeys® Graphic Literacy practice test is the most challenging of them all. Level 7 items use extremely complex, dense graphics and require you to demonstrate that you are highly skilled in reading and comprehending graphical data. You will need to interpret trends, make inferences, and justify decisions. You may also be asked to identify and justify the most effective graphic given a defined purpose.
Quiz Summary
0 of 5 Questions completed
Questions:
Information
You have already completed the quiz before. Hence you can not start it again.
Quiz is loading…
You must sign in or sign up to start the quiz.
You must first complete the following:
Results
Results
0 of 5 Questions answered correctly
Your time:
Time has elapsed
You have reached 0 of 0 point(s), (0)
Earned Point(s): 0 of 0, (0)
0 Essay(s) Pending (Possible Point(s): 0)
Categories
- Not categorized 0%
-
Question 1 of 5
1. Question
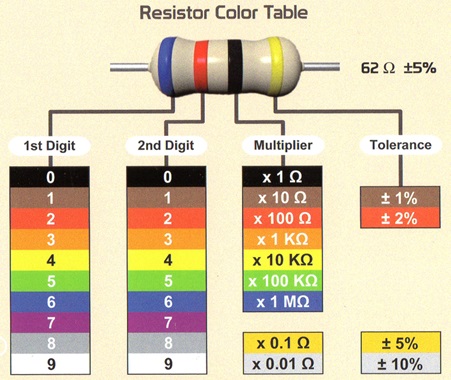
An electronics technician uses the “Resistor Color Table” below to determine the resistance of the resistors he works with. To do so, he needs the colors of the first three bands, starting on the left and moving right (the color of the rightmost band can be ignored).
For a resistor with the color code Blue-Red-Black, he knows to translate it as Blue=6, Red=2, Black=“multiply by 1.” Such a resistor has a resistance of 62 ohms (62 ∗ 1 = 62).
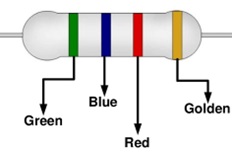
The following resistor has the color code Green-Blue-Red, which translates as Green=5, Blue=6, Red=“multiply by 100” for a resistance of 5600 ohms (56 ∗ 100 = 5600).
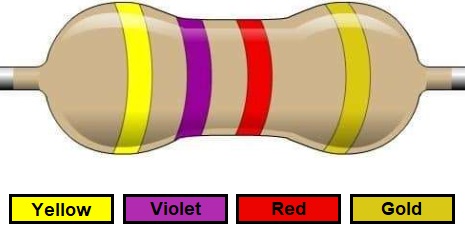
What is the resistance of the following resistor that he is currently analyzing?
 CorrectIncorrect
 -
Question 2 of 5
2. Question
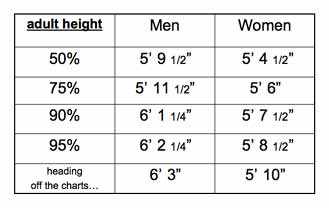
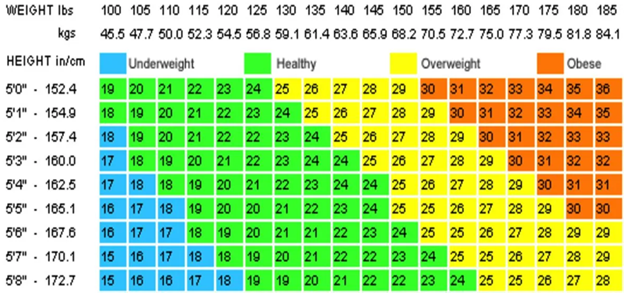
Josi is an adult woman whose height is considered the 75th percentile (75%) of women. What is the most she can weigh, in pounds, and still be considered healthy according to the provided BMI chart?
Adult Height Percentiles
Body Mass Index (BMI)
 CorrectIncorrect
 -
Question 3 of 5
3. Question
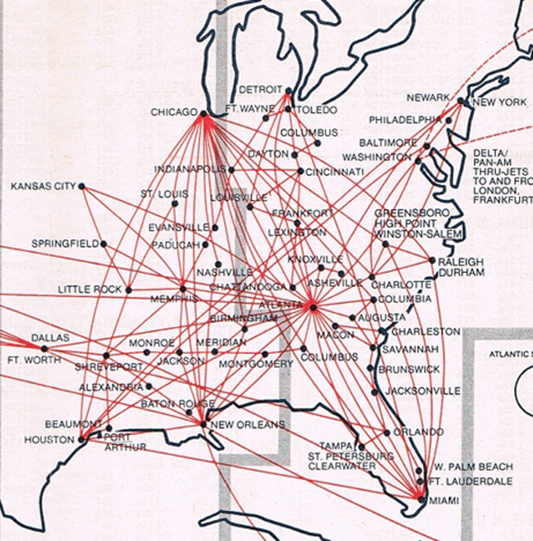
The following graphic is taken from an airline’s route map from 1970. For a portion of the United States, the map shows flights that the airline flew between various cities. Which city appears to be the busiest for this airline?
 CorrectIncorrect
 -
Question 4 of 5
4. Question
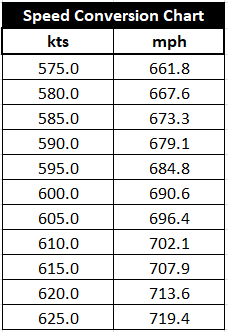
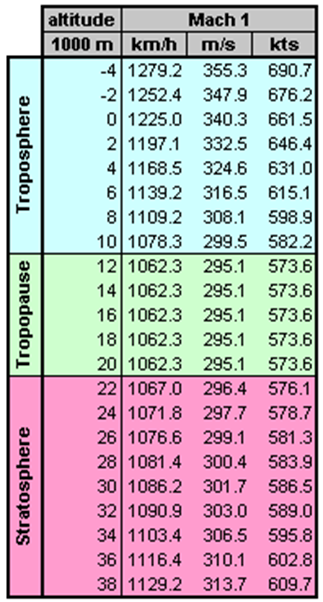
An experimental scramjet reached a speed of Mach 1 during a test flight in the Stratosphere. It was travelling 685 mph when it achieved Mach 1. Based on the information below, at what altitude was the jet most-likely traveling?
 CorrectIncorrect
 -
Question 5 of 5
5. Question
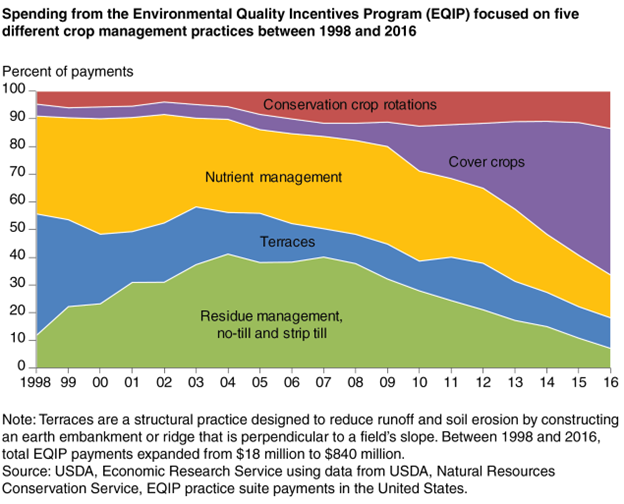
A researcher at a thinktank is reviewing USDA documents to attempt to better understand the impact of funding on the five crop management practices shown in the graph.
Knowing that the graph shows the percentage of total funding that each practice received in a given year, he is able to calculate that “Terraces” received approximately 42% (55 − 13 = 42%) of the total funding in 1998.
When the researcher estimates the percentage of total funding that “Cover crops” received in 2016, what will be the result?
 CorrectIncorrect
- 1
- 2
- 3
- 4
- 5
- Current
- Correct
- Incorrect
