This Level 6 Graphic Literacy practice test is much more challenging. Level 6 is the second most difficult level, and it includes very complicated and detailed graphs, charts, diagrams, and tables. The graphics contain more information and there may be multiple graphics. You will be asked to interpret patterns and to make decisions based on one graphic after finding information in another graphic.
Quiz Summary
0 of 5 Questions completed
Questions:
Information
You have already completed the quiz before. Hence you can not start it again.
Quiz is loading…
You must sign in or sign up to start the quiz.
You must first complete the following:
Results
Results
0 of 5 Questions answered correctly
Your time:
Time has elapsed
You have reached 0 of 0 point(s), (0)
Earned Point(s): 0 of 0, (0)
0 Essay(s) Pending (Possible Point(s): 0)
Categories
- Not categorized 0%
-
Question 1 of 5
1. Question
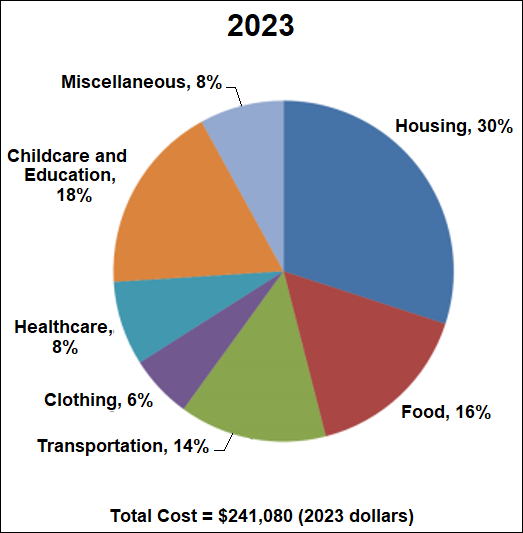
A researcher used the pie chart below to calculate the “Transportation” cost for 2023. To do so, he multiplied the percentage by the total cost: (0.14)($241,080) = $33,751. He then determines the “Housing” cost. What value does he obtain?
 CorrectIncorrect
 -
Question 2 of 5
2. Question
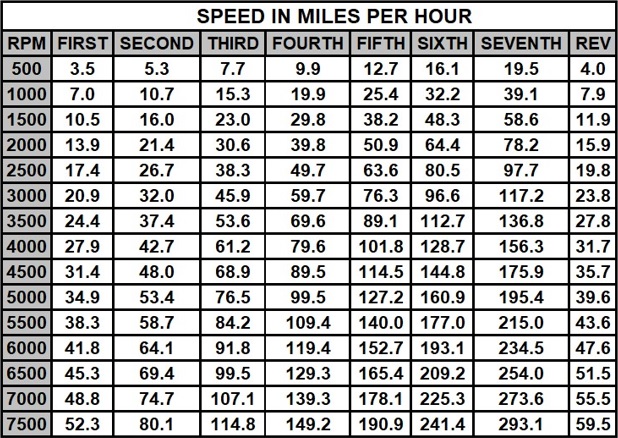
Sofia is an engineer at a domestic car company. The rows of the chart below show the engine RPM (“RPM”), while the columns show the transmission gear that the car is in. Where the the two intersect, we have the speed in miles per hour. She notes that at 5000 RPM in Fourth gear, the car is traveling 99.5 miles per hour. If the test driver were to go the same speed in Third gear, what would be the expected engine RPM?
 CorrectIncorrect
 -
Question 3 of 5
3. Question
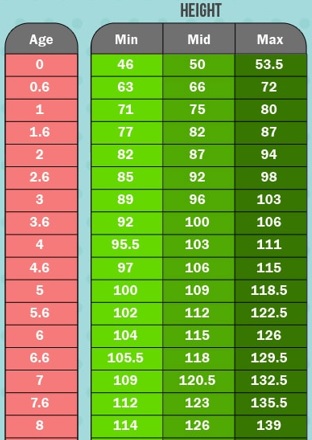
The following growth chart shows the minimum (“Min”), median (“Mid”), and maximum (“Max”) heights in centimeters for boys of a certain age. Boy A and Boy B are the same heights. Boy A’s height is considered the minimum height for a 7 year old. Boy B’s height is considered the median (“mid”) height for his age. How old is Boy B?
 CorrectIncorrect
 -
Question 4 of 5
4. Question
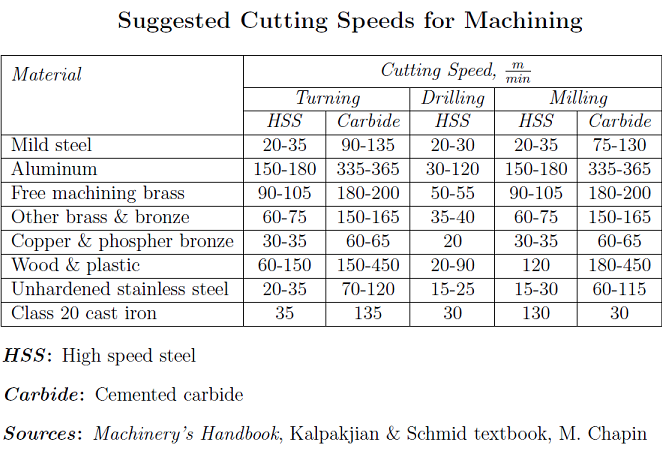
The chart below shows the recommended cutting speeds for three machining processes (turning, drilling, and milling) based on the material being machined (shown in the first column) and the type of cutting tool (HSS or Carbide) being used. The machining department is currently performing a Turning process using a Carbide cutting tool and has the machine properly set at 62 m/min. What material is being machined?
 CorrectIncorrect
 -
Question 5 of 5
5. Question
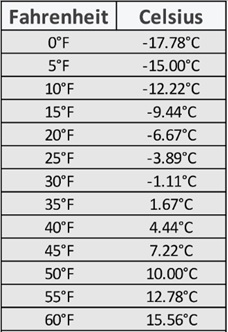
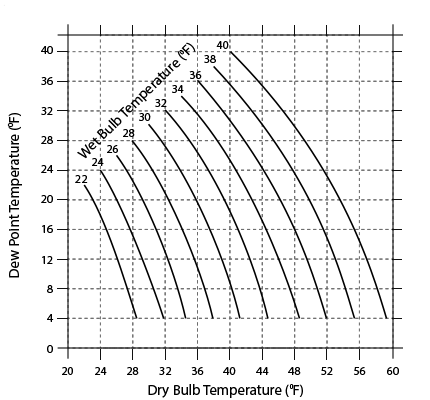
A climate researcher obtains the following temperature information: the Dry Bulb Temperature is 10°C (Celsius) and the Dew Point Temperature is −12.22°C. She first uses the top chart in order to convert the Celsius temperatures to Fahrenheit. She then uses the graph to determine the corresponding Wet Bulb Temperature. What is this corresponding Wet Bulb Temperature?
 CorrectIncorrect
- 1
- 2
- 3
- 4
- 5
- Current
- Correct
- Incorrect
